
I bought a second hand M-DAC a while ago to have a well-known commercial reference in terms of measurements and sound. After teardown it is time for measurements. This first part consists of basic performance measurements.
I chose M-DAC as my reference for several reasons. First of all, it has been very popular and highly praised instrument in its price class. That makes it a solid reference in terms of sound, and also gave me the practical aspect of being readily available second hand, saving me money. Another aspect is the amount of digital filter options it provides; M-DAC has seven user selectable filters. I am curious to see if I can hear sonic differences between these filters, but I also want to measure the differences. Digital filters play crucial role in DACs, significantly altering the technical performance and possibly sound as well.
Measurements introduction
This measurement series focuses on technical measurements only. Later on I will try to address if I can draw any conclusions between measurements and sound. But as always, that is highly subjective unlike numbers and graphs.
This first part focuses on base performance such as THD+N, SNR, noise, frequency response, and so on.
The second part will dive deeper into the differences between the digital filters. M-DAC having as many as seven filter options, there will be loads of data.
The data for the first two parts is ready when writing this. Later on when I will have access to a better audio analyser, I will try to do few jitter tests. This is something I have not done before and want to study the topic a bit. This would be the part three.
Audio measurements
I have written few posts regarding basic audio measurements that give some information and definitions if you are not familiar with the following:
Otherwise good source of information is Audio Precision website.
M-DAC specifications
Following specifications are taken from Audiolab website. Although this is not the worst, Hifi manufacturers tend to give the minimum amount of information.
- DAC: ESS Sabre32 9018 chip
- Resolution: 32 bits
- Maximum Sampling Frequency: 84.672 MHz
- Digital input:
- 2 x 24-bit/192kHz coaxial
- 2 x 24-bit/96kHz Toslink optical
- 1 x 24-bit/96kHz USB
- Digital output:
- 1 x coaxial
- 1 x Toslink optical
- Output voltage:
- RCA: 2.25 V RMS
- XLR: 4.5 V RMS
- Total Harmonic Distortion:
- RCA: <0.002 %
- XLR: <0.0008 %
- Frequency response: 20 Hz – 20 kHz (± 0.2 dB)
- Dynamic range:
- RCA: >115 dB
- XLR: >122 dB
- Crosstalk:
- RCA: <-120 dB
- XLR: <-130 dB
When measurement settings and conditions are usually not well defined, one can always assume they are whatever gives the best numbers. For example above, I assume these are all with ‘Optimal Spectrum’ filter, bandwidth limited to 20 kHz, and A-weighting used for dynamic range measurement.
Measurement results
I took the M-DAC to my work where I have access to Audio Precision analysers. The measurements of this part have been carried out with APx585.
Coaxial input was used for all measurements and M-DAC set in DAC-mode (as opposed to preamplifier mode) with full 0 dB gain. By default, 48 kHz sample rate and balanced output is used. Other sample rates and outputs are compared to this.
In the basic measurements in this part 1, ‘Optimal Spectrum’ filter is used as it gives technically the best results. In the part 2 we will see why.
Measurements referred to headphone output are measured without load. I may repeat the measurements with typical headphone load later.
Gain
Gain does not vary between settings.
Balanced output (XLR) gain is 4.6 Vrms/FS, meaning full-scale output at 0 dB gain.
Unbalanced output (RCA) is half of that at 2.3 Vrms/FS.
Headphone output (6.3mm on front panel) is the same as unbalanced, 2.3 Vrms/FS.
SNR
Bandwidth here is limited to 20 kHz.
Signal-to-noise ratio using balanced output is 119 dBA (A-weighted). This appears in all 48 kHz measurements. Corresponding figure for unbalanced output is 113 dBA. Typically balanced output yields 3 dB better SNR as signal level is 6 dB higher but noise gain is 3 dB; however, here noise level remains the same.
Headphone output follows the RCA output figure of 113 dBA.
These figures are 2-3 dB short of specification. However, SNR seems to improve with higher sample rates. Looking at balanced output, we see following:
- 48 kHz: 119 dBA
- 96 kHz: 120 dBA
- 192 kHz: 121 dBA
Therefore, I do believe in some case one could measure the stated 122 dBA (which in fact is 121.5 dBA in the manual).
I do not know why noise level improves with sample rate. This ESS DAC has very high dynamic range so I would assume output stage is the main noise contributor, and would remain constant. Or maybe higher sample rate leads to different noise shaping in the DAC. Nevertheless, the dynamic range is very high and nobody should feel worried of using digital volume control in the preamp mode.
THD+N
Single-point THD+N ratio figure at 0 dBFS level from balanced output is quite consistently 0.0012 % (-98 dB) for both channels. This does not meet the spec of 0.0008 % given on the website. Interestingly though, the spec in the manual is 0.0015 %. But again, there is no measurement point given in the spec.
Corresponding figure from the RCA output is the same 0.0012 % and in spec.
Below is a table of the distortion products, showing third harmonic dominates.
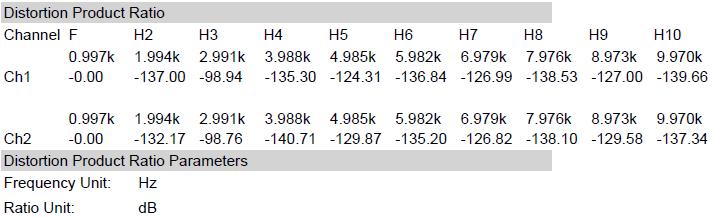
THD products
THD+N graphs
Below is a THD+N ratio versus amplitude and THD+N level versus amplitude graphs. Amplitude here is the digital input signal amplitude.
We can see small increase in THD in left channel between -35 dBFS and -10 dBFS. Otherwise the shape of the curve is quite typical and gives one possibility for the lower spec figure of 0.0008 % seen on the website. Maybe they (marketing?) decided to pick the lowest point of the curve as a spec and just did not bother mentioning any level? Just one annoying trick to make the numbers look nice. Typically THD+N for a DAC is stated at or very close to maximum level, for example 0 dBFS or -1 dBFS.
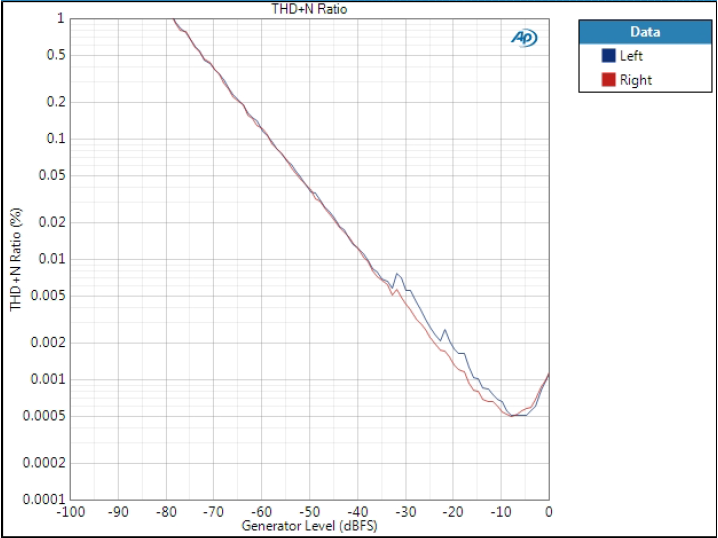
THD+N ratio vs. input signal amplitude
THD+N level basically shows the noise floor (-105 dBV) and dynamic range.
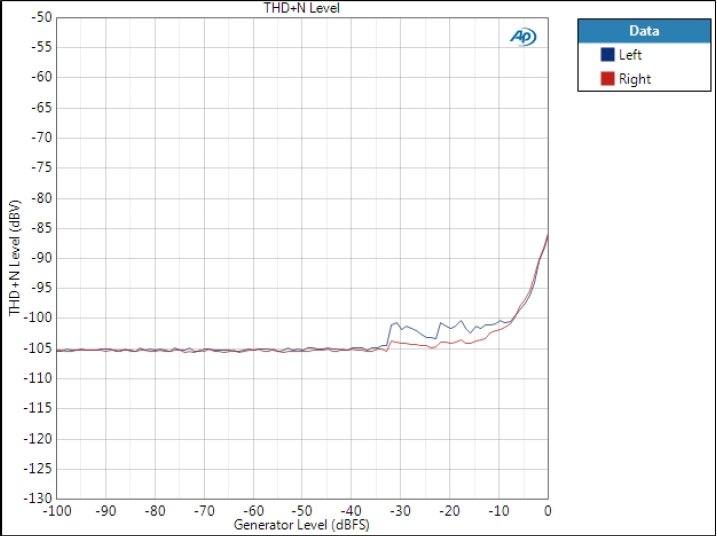
THD+N level vs. input signal amplitude
That increase in THD in the left channel is practically insignificant but interesting anomaly.
IMD
Intermodulation distortion is something I have not really measured before and cannot comment much on the numbers. I did measure it now to have some reference later when measuring my own devices. I recorded both SMPTE and CCIF type measurements.
Stimulus in IMD measurements contains two simultaneous sine waves and the distortion components of interest are the difference frequencies of the two sine waves.
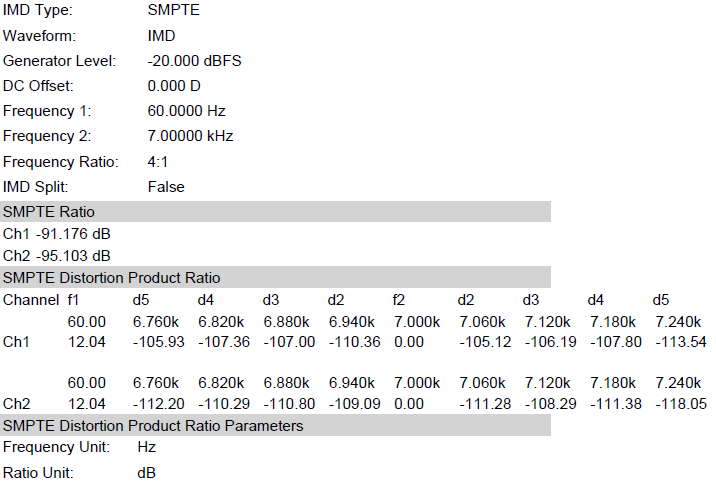
IMD SMPTE results
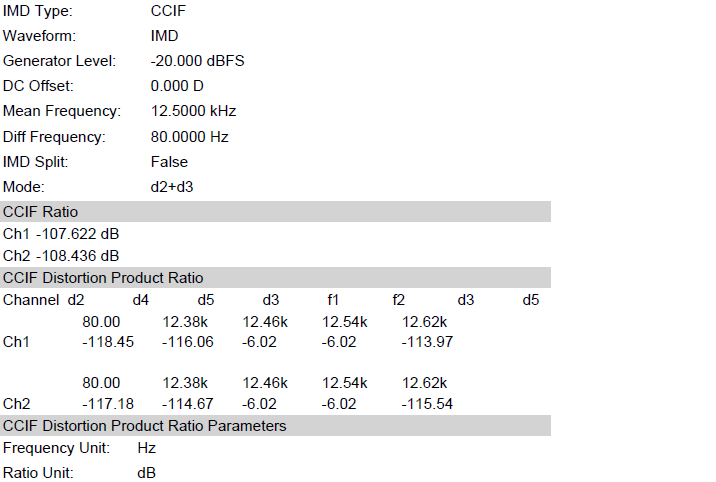
IMD CCIF results
Frequency response
This is a measurement we will see lots of differences when looking at the various filter options in the part 2. No surprises here.
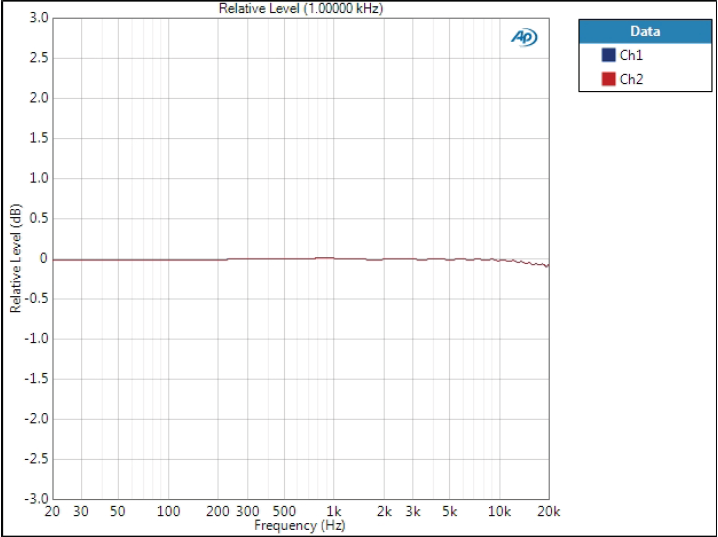
Frequency response
Crosstalk
Crosstalk was measured only as single-point measurement at 10 kHz.
Balanced output shows superb crosstalk, varying between -128 dB and -130 dB. Unbalanced crosstalk is in the order of -116 dB / -110 dB (left/right). Website specification does not state frequency but the manual notes it as 1 kHz. Typically crosstalk is due to capacitive coupling and increases 20 dB/decade so these are will within spec and superb figures.
DC level
This does vary slightly between settings and outputs but maximum levels were around 5 mV, typical 0-2 mV.
Delay
Delay depends on the sample rate and the part of delay caused by the digital filter is halved when the sample rate doubles. Following figures were measured:
- 48 kHz: 1042 µs
- 96 kHz: 521 µs
- 192 kHz: 292 µs
Conclusions
As expected, M-DAC performance is excellent and no surprises were really seen. The next part focuses on the digital filters where results get interesting and offer some unexpected graphs as well.
References and additional information
- Internal links
- M-DAC teardown
- Posts regarding audio measurements:
- External links
Version history
This page
- 29.10.2018 Initial version
2 comments
Great measurement.
I’m looking forward to the part 2!
Thanks! Unfortunately releasing the part 2 has taken time due to working on new boards but I will post it soon.
Comments are closed.