- Presents the unwanted part of signal – something that was not put there and should not be there.
- THD+N vs. amplitude graph is important as it reveals SNR, dynamic range, and THD+N ratio; all are expressed as ratio compared to a specified signal level.
- The difference between THD+N level and THD+N ratio must be understood.
- Signal level, signal frequency, and measurement bandwidth must be known (or guessed) when analysing results.
THD+N, Total Harmonic Distortion plus Noise, is one of the best audio measurements, especially when plotted across amplitude. It presents everything that is unwanted in the signal – distortion and noise. Although the name implies it only takes harmonic distortion into account, it counts everything but the signal itself in the defined measurement bandwidth.
THD+N can be given as single number or graph, and can be absolute value or ratio. In audio device specifications it is usually given as ratio (units % or dB) but in audio measurements the absolute value (units dBV or Volts) is handy. Examples are given below.
Sometimes a special case can be THD only, then it only contains the harmonic distortion components – no other distortion components or noise.
Harmonic distortion components are integer multiples of the fundamental; for example, 1 kHz tone has harmonics at 2 kHz, 3 kHz, etc.. If these frequencies are present in the system although we did not put them in, they are distortion. However, practically THD+N means everything except the fundamental – harmonic and non-harmonic components and noise as it is measured by filtering out the fundamental and measuring all that is left.
To illustrate THD+N with FFT graphs, below is spectrum of 1 kHz 2 Vrms tone. Some harmonic distortion components and noise are present.
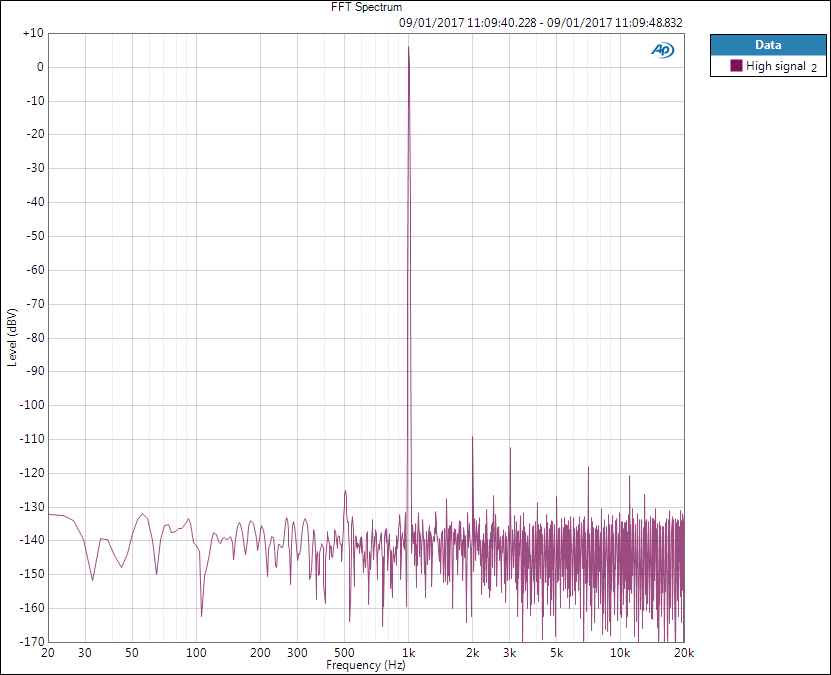
Spectrum of a 1 kHz tone.
If THD+N level is measured, below is what the analyser would see (forgive me my Paint image editing).
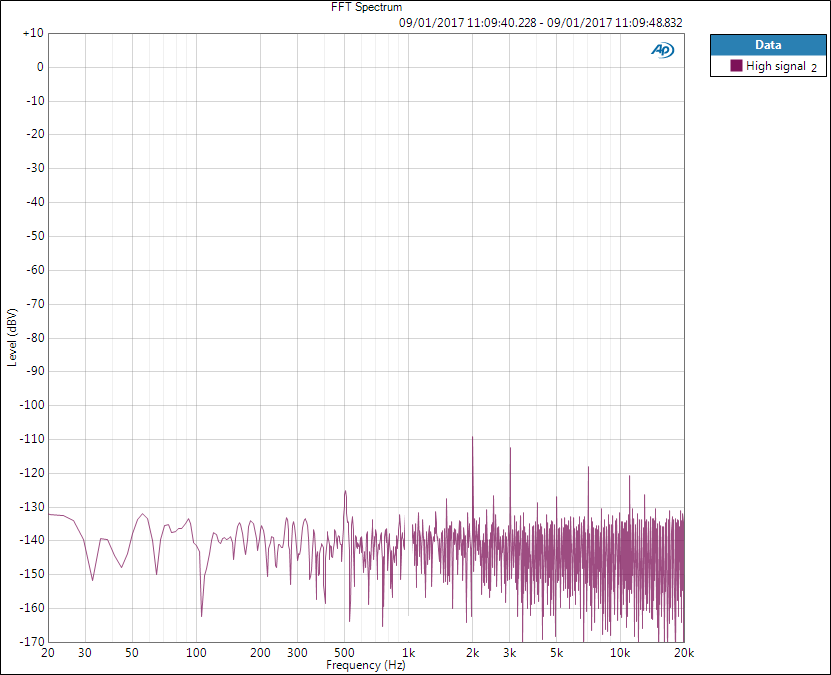
Spectrum of a 1 kHz tone but the fundamental removed.
If only THD level (until 7th harmonic) is measured, below is what the analyser would see.

Harmonic distortion components (up to 7th) of the above spectrum.
The analyser would then sum the residual components to get THD+N level and compare to the (removed) fundamental for THD+N ratio.
The difference in spectra is dramatic but in single numbers it would not be as dramatic as the sum is calculated as RMS sum where large values dominate.
From the first graph we see that signal level is 6 dBV (2 Vrms). THD+N level cannot be seen from FFT but in this example it is -103 dBV, therefore giving THD+N ratio of -109 dB (-109-6 ) which again can be given as 0.00035 % (10^(-109/20)*100). However, if only single value is given, we need to know the measurement conditions – although are they omitted in specifications we need to guess.
“THD+N of H-DAC is 0.0007 %” – what does this mean and what else should be known?
As it is given as %, it is clearly a ratio. It could be also in dB: 20*log10[0.0007/100] = -103 dB. If it was given as level, it would be in dBV or Vrms (or uVrms).
Regarding the measurement, we still need to know and understand following conditions.
Signal level and frequency
Signal level in DACs is typically maximum output level, or 0 dBFS. It should be still stated as actual voltage coming out of the DAC; for example “signal level is 0 dBFS / 2 Vrms”. It is clear as higher level cannot be get, 0 dBFS is the maximum level of digital signal.
In analog devices there is no such thing maximum output level so it must be defined. It can be also reversed; for a power amplifier it is common to give the output power at certain THD+N ratio: “output power at 1 % distortion: 50 W”. More power can be drawn but the distortion will increase. Similarly output voltage could be given.
Signal frequency must be defined as well but is typically 1 kHz.
Measurement bandwidth
Noise in these systems is white noise, meaning its power spectral density is flat. This means that noise power is proportional to the bandwidth – double the bandwidth, double the noise (power). Therefore, for the best THD+N number we want to use as small bandwidth as possible. Typically this is the common audio bandwidth 20 Hz – 20 kHz, and we can assume that if it is not given. If you see term AES17 mentioned, it is a (steep) low-pass measurement filter standard.
Bandwidth is even more important if signal frequency is significantly higher than 1 kHz as it may affect the harmonics – and we are measuring harmonic distortion. For example, if signal frequency is over 10 kHz and measurement bandwidth 20 kHz, no harmonics fit within the measurement bandwidth and we are not actually measuring harmonic distortion at all anymore.
THD+N vs. amplitude plot
Below is THD+N level vs. amplitude plot of H-DAC. Digital signal level is swept from -100 to 0 dBFS and THD+N level measured in dBV (which effectively is Volts). Three single measurements can be derived from this graph when we know that the maximum output level of H-DAC is 6 dBV.
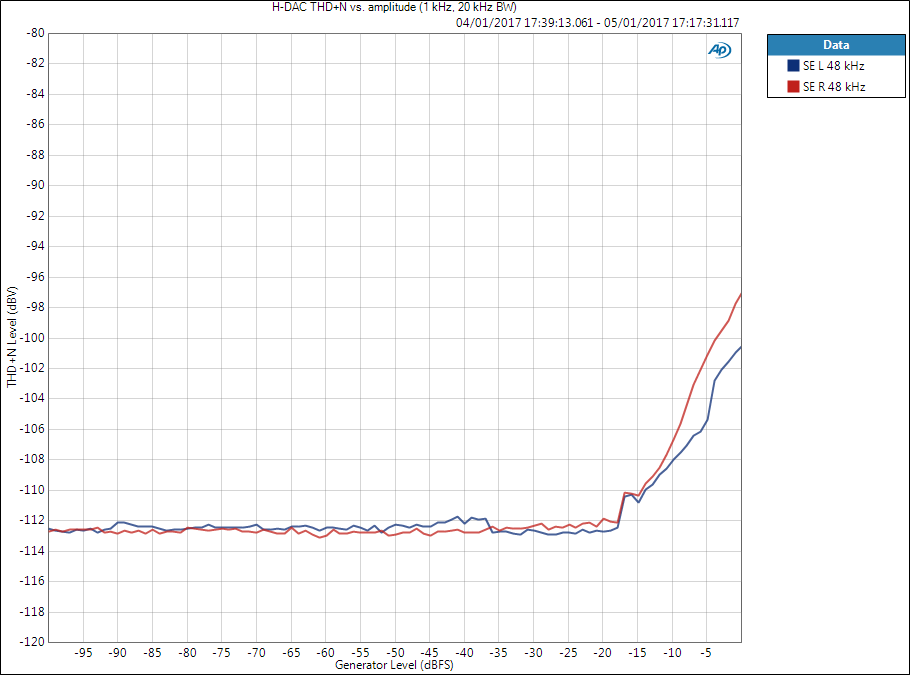
THD+N vs. amplitude sweep.
Noise and SNR
On the left-hand side, when signal level is very small, we see the noise floor of the system. In this case it is -113 dBV so SNR is 6 dBV-(-113 dBV) = 119 dB (non-weighted). Typically SNR is given as A-weighted value, see another post regarding the topic.
Dynamic range
In the middle we have noise in the presence of medium amplitude signal. Dynamic range is calculated the same way as SNR but noise is measured in the presence of small to medium amplitude signal, e.g. -60 dBFS. Typically for a modern high-quality device it is the same as SNR, as here.
Some digital devices may mute outputs completely when signal is not present. In that case SNR would look too good when measured the typical way as a ratio of two separate measurements. Measuring noise in the presence of signal, or dynamic range, prevents this.
See more about noise, SNR, and dynamic range.
THD+N (ratio)
On the right-hand side of the plot where THD+N level starts increasing, the distortion starts dominating over the noise. In this case we have clear differences between channels but THD+N ratio at 0 dBFS would be -107 dB for left channel and -103 dB for right channel (again the ratio of signal level and THD+N level). Or 0.00045 % and 0.00071 %, respectively. I like decibels more but percentages are used more.
THD+N vs. frequency
Now amplitude is kept constant, for example maximum, and swept across frequency. Signal amplitude and measurement bandwidth should be given. If measurement bandwidth was the same, the points at 1 kHz here would match the rightmost points of above THD+N vs. amplitude plot.
Measurement bandwidth here is important to understand, as has been described above. At higher frequencies the harmonic components will be filtered out by the measurement filter.
THD+N vs. frequency is not as commonly used as the abovementioned figures but can be useful when analysing system performance.
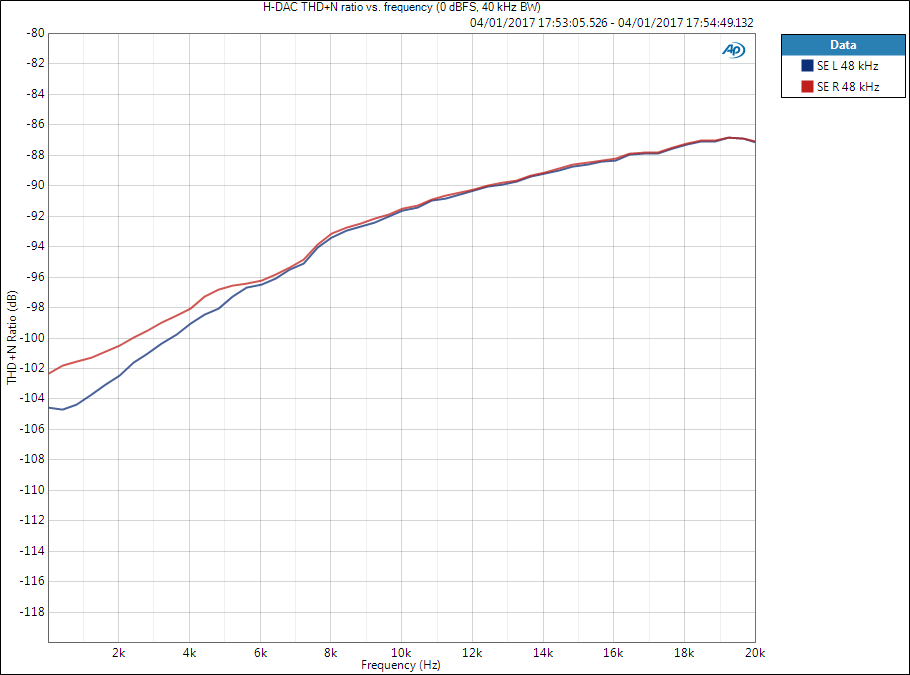
THD+N vs. frequency sweep.
THD+N can be also measured across power which is common in power amplifiers. I will write another post regarding this when I have done such measurements.
References
- Audio Precision: Signal-to-noise Ratio (SNR), Dynamic Range, and Noise
- Audio Precision: More about THD+N and THD
- Wikipedia: White noise